Aprenda instalar o ElastiFlow, uma poderosa ferramenta para análise de tráfego de rede no Debian 11 Bullseye

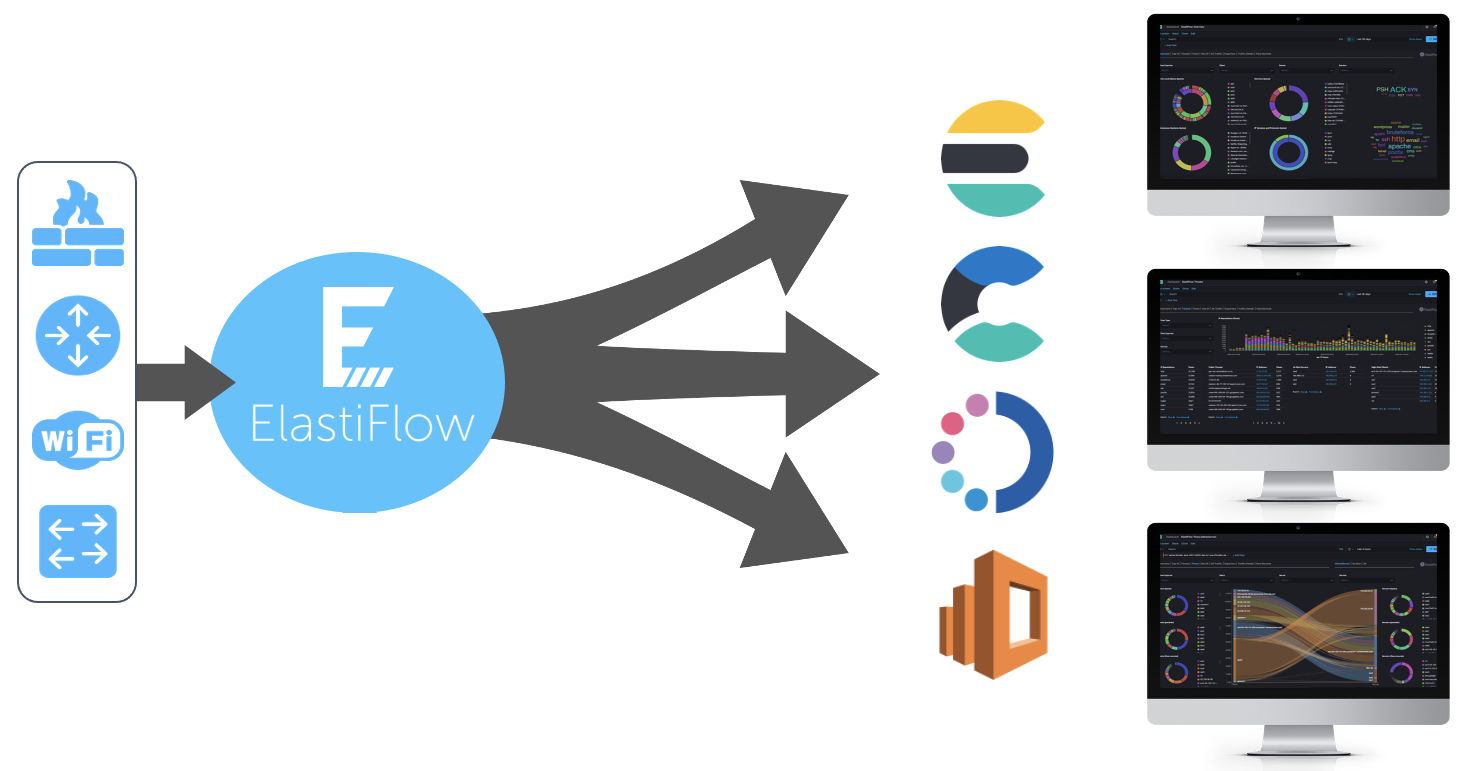
Coletor de fluxo unificado ElastiFlow
O ElastiFlow ™ Unified Flow Collector recebe, decodifica, transforma, normaliza, traduz e enriquece registros de fluxo de rede e telemetria enviados de dispositivos e aplicativos de rede usando IPFIX, Netflow e sFlow. Os registros resultantes podem ser enviados para diversas plataformas e serviços.
Requisitos de sistema acesse aqui.
Com seu Debian 11 (Bullseye) 64 bits. Instalação mínima pronta
Existem outras formas de configurar, mas aqui tentei passar a forma mais simples possível para que qualquer um consiga insta-lo. 🙂
# su -
Instale os pacotes básicos necessários
# apt install wget apt-transport-https gnupg unzip curl net-tools
Recomendo a instalacao dos firmwares binário para vários drivers do kernel Linux, para isso adicione contrib non-free ao seu repositório.
# vim /etc/apt/sources.list
deb http://deb.debian.org/debian/ bullseye main contrib non-free
deb-src http://deb.debian.org/debian/ bullseye main contrib non-free

deb http://security.debian.org/debian-security bullseye-security main contrib non-free
deb-src http://security.debian.org/debian-security bullseye-security main contrib non-free

# bullseye-updates, to get updates before a point release is made;
# see https://www.debian.org/doc/manuals/debian-reference/ch02.en.html#_updates_and_backports
deb http://deb.debian.org/debian/ bullseye-updates main contrib non-free
deb-src http://deb.debian.org/debian/ bullseye-updates main contrib non-free
# apt update
# apt install firmware-linux firmware-linux-free firmware-linux-nonfree
Tuning no kernel
# echo "vm.swappiness=10" >> /etc/sysctl.conf
# echo "vm.max_map_count=262144" > /etc/sysctl.d/70-elasticsearch.conf
# cat <<EOF >/etc/sysctl.d/60-net.conf
net.core.netdev_max_backlog=4096
net.core.rmem_default=262144
net.core.rmem_max=67108864
net.ipv4.udp_rmem_min=131072
net.ipv4.udp_mem=2097152 4194304 8388608
EOF

# sysctl -w vm.max_map_count=262144 && \
sysctl -w net.core.netdev_max_backlog=4096 && \
sysctl -w net.core.rmem_default=262144 && \
sysctl -w net.core.rmem_max=67108864 && \
sysctl -w net.ipv4.udp_rmem_min=131072 && \
sysctl -w net.ipv4.udp_mem='2097152 4194304 8388608'
Reinicie para que os novos módulos sejam carregado.
# reboot
:: Elastic Stack ::
Será necessário ter o Java instalado.
# su -
# apt install default-jre
Adicione o repositório elastic.
# wget -qO - https://artifacts.elastic.co/GPG-KEY-elasticsearch | apt-key add -
# echo "deb https://artifacts.elastic.co/packages/8.x/apt stable main" |  tee -a /etc/apt/sources.list.d/elastic.list
# apt update
:: Elasticsearch ::
Elasticsearch é um mecanismo de pesquisa baseado em texto completo.
# apt install elasticsearch
Se uma JVM for iniciada com tamanhos de heap inicial e máximo desiguais, ela poderá pausar conforme o heap da JVM for redimensionado durante o uso do sistema. Por esse motivo, é melhor iniciar a JVM com os tamanhos de heap inicial e máximo configurados com valores iguais.
Adicione o arquivo e defina e heap.optionsa cerca de um terço da memória do sistema, mas não exceda . Para este exemplo, usaremos 12 GB dos 32 GB de memória disponíveis para heap da JVM.
# echo -e "-Xms12g\n-Xmx12g" > /etc/elasticsearch/jvm.options.d/heap.options
Os limites do sistema aumentados devem ser especificados em um systemd.
# mkdir /etc/systemd/system/elasticsearch.service.d
# cat <<EOF >/etc/systemd/system/elasticsearch.service.d/elasticsearch.conf
[Service]
LimitNOFILE=131072
LimitNPROC=8192
LimitMEMLOCK=infinity
LimitFSIZE=infinity
LimitAS=infinity
EOF
Após instalação vamos alterar network.host para ouvir apenas localhost, em seguida ativar o serviço e inicia-lo.
# sed -i 's/#cluster.name: my-application/cluster.name: elastiflow/' /etc/elasticsearch/elasticsearch.yml
# sed -i 's/#network.host: 192.168.0.1/network.host: 127.0.0.1/' /etc/elasticsearch/elasticsearch.yml
# sed -i 's/xpack.security.enabled: true/xpack.security.enabled: false/' /etc/elasticsearch/elasticsearch.yml
# echo "indices.query.bool.max_clause_count: 8192" >> /etc/elasticsearch/elasticsearch.yml
# echo "search.max_buckets: 250000" >> /etc/elasticsearch/elasticsearch.yml

# systemctl daemon-reload
# systemctl enable elasticsearch
# systemctl start elasticsearch
# systemctl status elasticsearch
● elasticsearch.service - Elasticsearch
     Loaded: loaded (/lib/systemd/system/elasticsearch.service; enabled; vendor preset: enabled)
    Drop-In: /etc/systemd/system/elasticsearch.service.d
             └─elasticsearch.conf
     Active: active (running) since Fri 2022-02-04 11:34:39 -03; 53s ago
       Docs: https://www.elastic.co
   Main PID: 4701 (java)
      Tasks: 60 (limit: 38490)
     Memory: 12.7G
        CPU: 52.548s
     CGroup: /system.slice/elasticsearch.service
             ├─4701 /usr/share/elasticsearch/jdk/bin/java -Xshare:auto -Des.networkaddress.cache.ttl=60 .....
             └─4893 /usr/share/elasticsearch/modules/x-pack-ml/platform/linux-x86_64/bin/controller

fev 04 11:34:23 debian systemd[1]: Starting Elasticsearch...
fev 04 11:34:39 debian systemd[1]: Started Elasticsearch.
Cheque se o mesmo esta funcionando
# curl -X GET "http://127.0.0.1:9200"
Retorno algo como….
{
  "name" : "debianFlows",
  "cluster_name" : "elastiflow",
  "cluster_uuid" : "mgKF5EP-SnKbbULl3D6aXQ",
  "version" : {
    "number" : "8.4.2",
    "build_flavor" : "default",
    "build_type" : "deb",
    "build_hash" : "89f8c6d8429db93b816403ee75e5c270b43a940a",
    "build_date" : "2022-09-14T16:26:04.382547801Z",
    "build_snapshot" : false,
    "lucene_version" : "9.3.0",
    "minimum_wire_compatibility_version" : "7.17.0",
    "minimum_index_compatibility_version" : "7.0.0"
  },
  "tagline" : "You Know, for Search"
}
:: kibana ::
Kibana é uma plataforma de análise e visualização usada para exibir os painéis do ElastiFlow.
# apt install kibana
Após instalação vamos alterar server.host, em seguida ativar o serviço e inicia-lo.
# echo "telemetry.enabled: false" >> /etc/kibana/kibana.yml
# echo "telemetry.optIn: false" >> /etc/kibana/kibana.yml
# echo "newsfeed.enabled: false" >> /etc/kibana/kibana.yml
# echo "server.host: \"0.0.0.0\"" >> /etc/kibana/kibana.yml
# echo "server.maxPayload: 8388608" >> /etc/kibana/kibana.yml
# echo "elasticsearch.requestTimeout: 132000" >> /etc/kibana/kibana.yml
# echo "elasticsearch.shardTimeout: 120000" >> /etc/kibana/kibana.yml
# vim /etc/kibana/kibana.yml
Ajuste para o endereço da sua URL(Domínio ou IP) pública, exemplo:
server.publicBaseUrl: "http://192.168.0.30:5601"
# systemctl daemon-reload
# systemctl enable kibana
# systemctl start kibana
# systemctl status kibana
● kibana.service - Kibana
     Loaded: loaded (/etc/systemd/system/kibana.service; enabled; vendor preset: enabled)
     Active: active (running) since Thu 2022-02-03 17:45:24 -03; 3s ago
       Docs: https://www.elastic.co
   Main PID: 4638 (node)
      Tasks: 11 (limit: 6548)
     Memory: 138.6M
        CPU: 4.339s
     CGroup: /system.slice/kibana.service
             └─4638 /usr/share/kibana/bin/../node/bin/node /usr/share/kibana/bin/../src/cli/dist\
                                           --logging.dest=/var/log/kibana/kibana.log\
                                           --pid.file=/run/kibana/kibana.pi>

fev 03 17:45:24 deb11 systemd[1]: Started Kibana.
:: ElastiFlow ::
ElastiFlow fornece coleta e visualização de dados de fluxo de rede usando o Elastic Stack.
# apt install libpcap-dev
# wget https://elastiflow-packages.s3.amazonaws.com/flow-collector/flow-collector_5.6.0_linux_amd64.deb
# dpkg -i flow-collector_5.6.0_linux_amd64.deb
# apt install -f
# systemctl daemon-reload
# systemctl enable flowcoll
# systemctl start flowcoll
# systemctl status flowcoll
● flowcoll.service - ElastiFlow Unified Flow Collector
     Loaded: loaded (/etc/systemd/system/flowcoll.service; enabled; vendor preset: enabled)
    Drop-In: /etc/systemd/system/flowcoll.service.d
             └─flowcoll.conf
     Active: active (running) since Fri 2022-02-04 13:49:34 -03; 8s ago
       Docs: https://docs.elastiflow.com
   Main PID: 10763 (flowcoll)
      Tasks: 9 (limit: 38490)
     Memory: 33.0M
        CPU: 105ms
     CGroup: /system.slice/flowcoll.service
             └─10763 /usr/share/elastiflow/bin/flowcoll
# wget https://raw.githubusercontent.com/elastiflow/elastiflow_for_elasticsearch/master/kibana/kibana-7.14.x-codex-dark.ndjson
# curl -XPOST "http://127.0.0.1:5601/api/saved_objects/_import?overwrite=true"\
 -k -H "kbn-xsrf: true" -H "securitytenant: global" --form file=@kibana-7.14.x-codex-dark.ndjson
No retornos dos comando curl certifique-se de ter no inicio a mensagem “success”:true”
{"successCount":229,"success":true,"warnings":[],"successResults...............
Configurações Avançadas Recomendadas do Kibana
Acesse seu Kibana no navegador. http://____:5601
Realizando esses ajustes avançados o Kibana produzirá uma experiência mais amigável ao usar o ElastiFlow. Essas configurações são feitas no Kibana, em Stack Management -> Advanced Settings.
Use a busca para localizar e ajustar os seguintes valores:
Pin filters by default: On
Highlight results : Off
Store URLs in session storage: On
Dark mode: On
Day of week: Monday
Formatting locale: Portuguese (Brazil)
Number format: 0,0.[00]
Percent format: 0,0.[00]%
Time filter defaults:
{
  "from": "now-1h/m",
  "to": "now"
}
Time filter quick ranges:
[
  {
    "from": "now-15m/m",
    "to": "now/m",
    "display": "Last 15 minutes"
  },
  {
    "from": "now-30m/m",
    "to": "now/m",
    "display": "Last 30 minutes"
  },
  {
    "from": "now-1h/m",
    "to": "now/m",
    "display": "Last 1 hour"
  },
  {
    "from": "now-2h/m",
    "to": "now/m",
    "display": "Last 2 hours"
  },
  {
    "from": "now-4h/m",
    "to": "now/m",
    "display": "Last 4 hours"
  },
  {
    "from": "now-12h/m",
    "to": "now/m",
    "display": "Last 12 hours"
  },
  {
    "from": "now-24h/m",
    "to": "now/m",
    "display": "Last 24 hours"
  },
  {
    "from": "now-48h/m",
    "to": "now/m",
    "display": "Last 48 hours"
  },
  {
    "from": "now-7d/m",
    "to": "now/m",
    "display": "Last 7 days"
  },
  {
    "from": "now-30d/m",
    "to": "now/m",
    "display": "Last 30 days"
  },
  {
    "from": "now-60d/m",
    "to": "now/m",
    "display": "Last 60 days"
  },
  {
    "from": "now-90d/m",
    "to": "now/m",
    "display": "Last 90 days"
  }
]
Ajustes finos:
# vim /etc/systemd/system/flowcoll.service.d/flowcoll.conf
Ajustes ELASTICSEARCH
Environment="EF_FLOW_OUTPUT_ELASTICSEARCH_ENABLE=true"
Environment="EF_FLOW_OUTPUT_ELASTICSEARCH_TIMESTAMP_SOURCE=end"
Environment="EF_FLOW_OUTPUT_ELASTICSEARCH_INDEX_TEMPLATE_ILM_LIFECYCLE=elastiflow"
#Environment="EF_FLOW_OUTPUT_ELASTICSEARCH_USERNAME=elastic"
#Environment="EF_FLOW_OUTPUT_ELASTICSEARCH_PASSWORD=changeme"
Ajustes DNS
Environment="EF_FLOW_DECODER_ENRICH_DNS_ENABLE=true"
Environment="EF_FLOW_DECODER_ENRICH_DNS_NAMESERVER_IP=1.1.1.1"
Ajustes MAXMIND
Environment="EF_FLOW_DECODER_ENRICH_MAXMIND_ASN_ENABLE=true"
Environment="EF_FLOW_DECODER_ENRICH_MAXMIND_GEOIP_ENABLE=true"
Environment="EF_FLOW_DECODER_ENRICH_MAXMIND_GEOIP_LANG=pt-BR"
Environment="EF_FLOW_DECODER_ENRICH_MAXMIND_ASN_PATH=maxmind/GeoLite2-ASN.mmdb"
Environment="EF_FLOW_DECODER_ENRICH_MAXMIND_GEOIP_PATH=maxmind/GeoLite2-City.mmdb"
# cd /etc/elastiflow/maxmind
# wget https://git.io/GeoLite2-ASN.mmdb
# wget https://git.io/GeoLite2-City.mmdb
# wget https://git.io/GeoLite2-Country.mmdb
Reiniciando os serviços
# systemctl daemon-reload
# systemctl restart flowcoll
# systemctl status flowcoll
# systemctl restart elasticsearch kibana
# systemctl status elasticsearch kibana
Configure seu router para enviar os flows
Bonus: Huawei NE Netstream (NetFlow)
ip netstream as-mode 32
ip netstream timeout active 1
ip netstream timeout inactive 15
ip netstream export version 9 origin-as
ip netstream export index-switch 32
ip netstream export template timeout-rate 2
ip netstream sampler fix-packets 128 inbound
ip netstream sampler fix-packets 128 outbound
ip netstream export source IPv4_LOOPBACK_ORIGEM
ip netstream export host IPv4_SERVIDOR 9995
ip netstream export template option sampler
ip netstream export template option application-label
#
ipv6 netstream as-mode 32
ipv6 netstream timeout active 1
ipv6 netstream timeout inactive 15
ipv6 netstream export version 9 origin-as
ipv6 netstream export index-switch 32
ipv6 netstream export template timeout-rate 2
ipv6 netstream sampler fix-packets 128 inbound
ipv6 netstream sampler fix-packets 128 outbound
ipv6 netstream export source IPv4_LOOPBACK_ORIGEM
ipv6 netstream export host IPv4_SERVIDOR 9995
ipv6 netstream export template option sampler

# CONFIG NO SLOT -- slot 9 ou 10 NE8000 / slot 3 NE40
# EXECUTE O CMD NO ROOT, COMANDO NÃO FUNCIONA NO VIRTUAL SYSTEM
slot 9
 ip netstream sampler to slot self
 ipv6 netstream sampler to slot self

# APLICAR APENAS NAS INTERFACES UPSTREAM (LINK IP, PTT, IX...)
ip netstream inbound
ip netstream outbound
ipv6 netstream inbound
ipv6 netstream outbound

# EM CASO DE INTERFACES DE CDN INTERNO, APLICAR:
ip netstream inbound
ipv6 netstream inbound

# EM CASO DE INTERFACE BILATERAL (ONDE TANTO RECEBE QUANTO ENVIA CONTEÚDO), APLICAR:
ip netstream inbound
ipv6 netstream inbound
Bonus: Mikrotik
/ip traffic-flow
set active-flow-timeout=1m cache-entries=4k enabled=yes interfaces=INTERFACES_COLETAR
/ip traffic-flow target
add dst-address=IP_SERVER_ASSTATS port=9995 src-address=IP_ORIGEM version=9
Verificar se os pacotes estão chegando na porta 9995
# apt install tcpdump
# tcpdump -i ens18 -n udp port 9995 -T cnfp
Acesse eu Kibana e seja feliz!
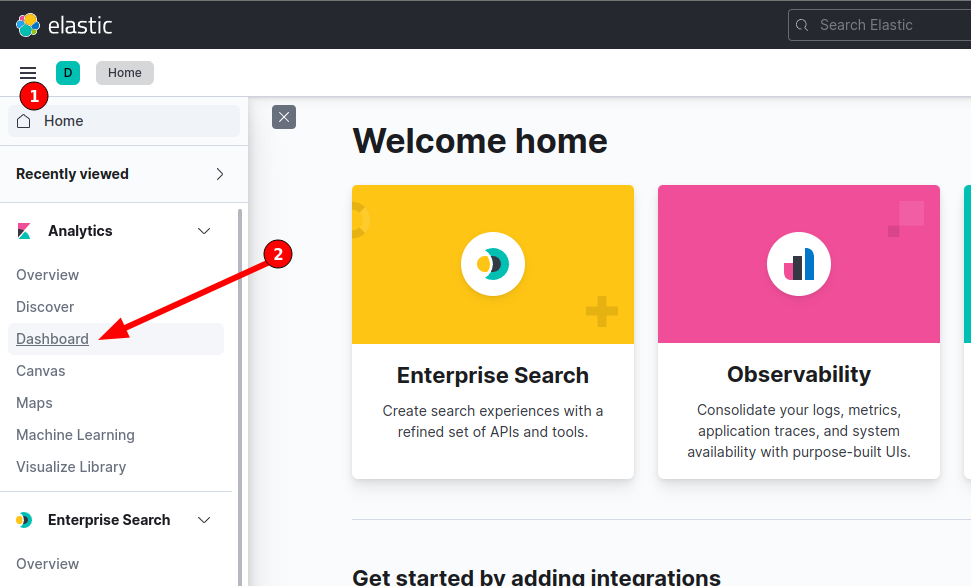
Escolha sua Dash
Gostou e quer me ajudar a manter o blog? 🙂
Se quiser fazer uma doação para o café ficarei muito feliz pelo seu reconhecimento!

Se não puder doar pode deixar seu agradecimento nos comentário também ficarei feliz em saber que ajudei. Se tiver qualquer pergunta deixe-a também. Se preferir entrar em Contato clique aqui.
Abraço!
Fonte:
https://docs.elastiflow.com


meus dashboard esta todos vazios, lá no servidor mostra que esta recebendo os fluxos, mais do dashboard nao aparece nada.
alguém pode ajudar.
root@elastiflow:~# systemctl status elasticsearch
● elasticsearch.service – Elasticsearch
Loaded: loaded (/lib/systemd/system/elasticsearch.service; enabled; vendor preset: enabled)
Drop-In: /etc/systemd/system/elasticsearch.service.d
└─elasticsearch.conf
Active: failed (Result: exit-code) since Sun 2024-05-19 09:16:34 -03; 47s ago
Docs: https://www.elastic.co
Process: 510 ExecStart=/usr/share/elasticsearch/bin/systemd-entrypoint -p ${PID_DIR}/elasticsearch.pid –quiet (code=exited, status=1/FAILURE)
Main PID: 510 (code=exited, status=1/FAILURE)
CPU: 4.250s
mai 19 09:16:34 elastiflow systemd-entrypoint[510]: at java.base/java.nio.file.TempFileHelper.create(TempFileHelper.java:134)
mai 19 09:16:34 elastiflow systemd-entrypoint[510]: at java.base/java.nio.file.TempFileHelper.createTempDirectory(TempFileHelper.java:171)
mai 19 09:16:34 elastiflow systemd-entrypoint[510]: at java.base/java.nio.file.Files.createTempDirectory(Files.java:1017)
mai 19 09:16:34 elastiflow systemd-entrypoint[510]: at org.elasticsearch.server.cli.ServerProcessUtils.createTempDirectory(ServerProcessUtils.java:64)
mai 19 09:16:34 elastiflow systemd-entrypoint[510]: at org.elasticsearch.server.cli.ServerProcessUtils.setupTempDir(ServerProcessUtils.java:53)
mai 19 09:16:34 elastiflow systemd-entrypoint[510]: … 6 more
mai 19 09:16:34 elastiflow systemd[1]: elasticsearch.service: Main process exited, code=exited, status=1/FAILURE
mai 19 09:16:34 elastiflow systemd[1]: elasticsearch.service: Failed with result ‘exit-code’.
mai 19 09:16:34 elastiflow systemd[1]: Failed to start Elasticsearch.
mai 19 09:16:34 elastiflow systemd[1]: elasticsearch.service: Consumed 4.250s CPU time.
Alguém conseguiu a solução para a falha, onde os graficos aparece por apenas 1 minuto e some?
Tem que ficar a todo momento reiniciando o flowcoll para que volte, mas para com 1 minuto ou menos.
Boa noite , eu to com um probleminha ,quando integro o Flow no concentrador ele coleta perfeitamente , mas quando adiciono na borda não funciona, alguem da uma luz , fiz testes em outras bordas e da na mesma ,ja concentrador funciona tranquilo.
Boa tarde,
Tive um problema em meu servidor e acabou que estou precisando reinstalar, tudo deu certo mnos as dashboards pis o link
wget https://raw.githubusercontent.com/elastiflow/elastiflow_for_elasticsearch/master/kibana/kibana-7.14.x-codex-dark.ndjson
está quebrado, teria como disponibilizar em outro local pra download
mesmo problem
Mesmo aqui
Boa tarde, tenta esse:
https://raw.githubusercontent.com/elastiflow/elastiflow_for_elasticsearch/refs/heads/master/kibana/flow/kibana-7.17.x-flow-codex.ndjson
Esqueci do curl kk
curl -XPOST “http://127.0.0.1:5601/api/saved_objects/_import?overwrite=true” -k -H “kbn-xsrf: true” -H “securitytenant: global” –form file=@kibana-7.17.x-flow-codex.ndjson
Da certo o Tuto em Debian 12 ? ja testou ?
Um problema Chato que enfrentei aqui foi o seguinte, fiz todo o tutorial e deu tudo certo, porém a operadora que fornece pra gente tem CDN ou seja o trafego dos CDNS fica com o ASN da operadora e não mostra se é Netflix ou Google que ta consumindo, alguém sabe como resolver essa questão?
Estou com um problema. Os serviços iniciaram, recebe e coletam os dados normalmente. Porém, após 30 segundos para de tratar os dados.
Vejo o seguinte log:
netflow:/# tail -f /var/log/elastiflow/flowcoll/flowcoll.log
2023-05-09T01:13:50.138-0300 info flowcoll server/metrics.go:125 UDP Server to Flow Decoder is 90% full
Estou com um problema. Os dados chegam normalmente, acompanho pelo tcpdum, porém os dados não são tratados. Eu reinicio o flowcoll e aparecem alguns dados por 30s segundos no discovery, mas depois não trata nenhum dado e eles chegam normalmente.
Estou tendo problemas, ao executar o comando
curl -XPOST “http://127.0.0.1:5601/api/saved_objects/_import?overwrite=true” -k -H “kbn-xsrf: true” -H “securitytenant: global” –form file=@kibana-7.14.x-codex-dark.ndjson
recebo a mensagem
{“statusCode”:400,”error”:”Bad Request”,”message”:”Unexpected token < in JSON at position 0"}
nesse caso provavelmente o arquivo está com a extensão errada ao baixar ou o nome está errado.
como corrigir?
com o arquivo correto, eu consegui o:
wget https://raw.githubusercontent.com/elastiflow/elastiflow_for_elasticsearch/master/kibana/flow/kibana-8.2.x-flow-codex.ndjson
Boa tarde, pessoal.
Segui todos os passos do tutorial e consegui receber o flow de um dispositivo mikrotik normalmente. Porém, ao adicionar um dispositivo cisco recebo o seguinte log:
root@netflow-01:~# tail -f /var/log/elastiflow/flowcoll/flowcoll.log
2023-03-27T20:19:19.440Z warn decode/netflow9.go:416 Netflow v9: template not yet received from xxx.xxx.xxx.xxx for session: 9995, observation domain: 0, template ID 256!
2023-03-27T20:19:19.440Z warn decode/netflow9.go:416 Netflow v9: template not yet received from xxx.xxx.xxx.xxx for session: 9995, observation domain: 0, template ID 256!
2023-03-27T20:19:19.440Z warn decode/netflow9.go:416 Netflow v9: template not yet received from xxx.xxx.xxx.xxx for session: 9995, observation domain: 0, template ID 256!
Alguém já pegou o mesmo problema ?
Ótimo tutorial, parabéns!
Olá, mesmo problema aqui, encontrou alguma solução?
Estou implementando aqui na empresa, e não existe mais o arquivo abaixo:
# wget https://raw.githubusercontent.com/elastiflow/elastiflow_for_elasticsearch/master/kibana/kibana-7.14.x-codex-dark.ndjson
Existe alguma alternativa ?
Att.
Frands Franco
Eu utilizei esse aqui e deu certo.
https://github.com/lsopromadze/netflowcollector-elk
Bom dia,
Estou implementando o excelente tutorial, mas não existe mais o arquivo:
# wget https://raw.githubusercontent.com/elastiflow/elastiflow_for_elasticsearch/master/kibana/kibana-7.14.x-codex-dark.ndjson. <—-
Procurei um substituto e não achei, poderia me ajudar ?
wget https://raw.githubusercontent.com/elastiflow/elastiflow_for_elasticsearch/master/kibana/flow/kibana-8.2.x-flow-codex.ndjson
Alguém conseguiu habilitar o servidor pra escutar na web em ipv6?
127.0.0.1 poderia ser trocado por localhost?
Muito bom esse tutorial, porem eu precisava de uma ajuda, não sei o que pode ser mas os gráficos para de atualizar quando chega em um certo intervalo e so volta quando reinicio a maquina, alguém que já passou por esse problema pode dar uma ajuda?
isso é recurso da maquina, o elastiflow consome muita memoria ram e processamento. quando mais interfaces você tiver exportando flow para o servidor, mais recursos ele vai consumir
Bom dia a todos!
Instalei em minha rede o Flow, mas gostaria da ajuda de alguem, pois meus graficos da dashboard nao estao plotando corretamente, estão picotando! alguem passou por isso?
Diante mao ja gostaria de deixar meu agradecimento a esse blog por nos ensinar esses tutoriais de grande utilidade! muito show mesmo!
Alguém poderia me ajudar?
Executing: /lib/systemd/systemd-sysv-install enable elasticsearch
Created symlink /etc/systemd/system/multi-user.target.wants/elasticsearch.service → /lib/systemd/system/elasticsearch.service.
Job for elasticsearch.service failed because the control process exited with error code.
See “systemctl status elasticsearch.service” and “journalctl -xe” for details.
root@elastiflow:~# journalctl -xe
░░
░░ A unidade systemd-sysctl.service está sendo desligada.
jul 20 18:40:08 elastiflow systemd[1]: Starting Apply Kernel Variables…
░░ Subject: Unidade systemd-sysctl.service sendo iniciado
░░ Defined-By: systemd
░░ Support: https://www.debian.org/support
░░
░░ A unidade systemd-sysctl.service está sendo iniciada.
jul 20 18:40:08 elastiflow systemd[1]: Finished Apply Kernel Variables.
░░ Subject: Unidade systemd-sysctl.service concluiu a inicialização
░░ Defined-By: systemd
░░ Support: https://www.debian.org/support
░░
░░ A unidade systemd-sysctl.service concluiu a inicialização.
░░
░░ The start-up result is done.
jul 20 18:41:16 elastiflow sshd[4112]: pam_unix(sshd:auth): authentication failure; logname= uid=0 euid=0 tty=ssh ruser= rhost=61.177.173.46 user=root
jul 20 18:41:18 elastiflow sshd[4112]: Failed password for root from 61.177.173.46 port 26275 ssh2
jul 20 18:41:21 elastiflow sshd[4112]: Failed password for root from 61.177.173.46 port 26275 ssh2
jul 20 18:41:24 elastiflow sshd[4112]: Failed password for root from 61.177.173.46 port 26275 ssh2
jul 20 18:41:26 elastiflow sshd[4112]: Received disconnect from 61.177.173.46 port 26275:11: [preauth]
jul 20 18:41:26 elastiflow sshd[4112]: Disconnected from authenticating user root 61.177.173.46 port 26275 [preauth]
jul 20 18:41:26 elastiflow sshd[4112]: PAM 2 more authentication failures; logname= uid=0 euid=0 tty=ssh ruser= rhost=61.177.173.46 user=root
jul 20 18:41:52 elastiflow sshd[4118]: pam_unix(sshd:auth): authentication failure; logname= uid=0 euid=0 tty=ssh ruser= rhost=61.177.173.47 user=root
jul 20 18:41:54 elastiflow sshd[4118]: Failed password for root from 61.177.173.47 port 35658 ssh2
jul 20 18:41:57 elastiflow sshd[4118]: Failed password for root from 61.177.173.47 port 35658 ssh2
jul 20 18:42:00 elastiflow sshd[4118]: Failed password for root from 61.177.173.47 port 35658 ssh2
jul 20 18:42:01 elastiflow sshd[4118]: Received disconnect from 61.177.173.47 port 35658:11: [preauth]
jul 20 18:42:01 elastiflow sshd[4118]: Disconnected from authenticating user root 61.177.173.47 port 35658 [preauth]
jul 20 18:42:01 elastiflow sshd[4118]: PAM 2 more authentication failures; logname= uid=0 euid=0 tty=ssh ruser= rhost=61.177.173.47 user=root
jul 20 18:42:04 elastiflow sshd[4121]: pam_unix(sshd:auth): authentication failure; logname= uid=0 euid=0 tty=ssh ruser= rhost=61.177.173.47 user=root
jul 20 18:42:05 elastiflow sshd[4121]: Failed password for root from 61.177.173.47 port 29264 ssh2
jul 20 18:42:09 elastiflow sshd[4121]: Failed password for root from 61.177.173.47 port 29264 ssh2
jul 20 18:42:12 elastiflow sshd[4121]: Failed password for root from 61.177.173.47 port 29264 ssh2
jul 20 18:42:13 elastiflow sshd[4121]: Received disconnect from 61.177.173.47 port 29264:11: [preauth]
jul 20 18:42:13 elastiflow sshd[4121]: Disconnected from authenticating user root 61.177.173.47 port 29264 [preauth]
jul 20 18:42:13 elastiflow sshd[4121]: PAM 2 more authentication failures; logname= uid=0 euid=0 tty=ssh ruser= rhost=61.177.173.47 user=root
jul 20 18:43:06 elastiflow sshd[4124]: pam_unix(sshd:auth): authentication failure; logname= uid=0 euid=0 tty=ssh ruser= rhost=61.177.172.19 user=root
jul 20 18:43:08 elastiflow sshd[4124]: Failed password for root from 61.177.172.19 port 18670 ssh2
jul 20 18:43:11 elastiflow sshd[4124]: Failed password for root from 61.177.172.19 port 18670 ssh2
jul 20 18:43:14 elastiflow sshd[4124]: Failed password for root from 61.177.172.19 port 18670 ssh2
jul 20 18:43:15 elastiflow sshd[4124]: Received disconnect from 61.177.172.19 port 18670:11: [preauth]
jul 20 18:43:15 elastiflow sshd[4124]: Disconnected from authenticating user root 61.177.172.19 port 18670 [preauth]
jul 20 18:43:15 elastiflow sshd[4124]: PAM 2 more authentication failures; logname= uid=0 euid=0 tty=ssh ruser= rhost=61.177.172.19 user=root
jul 20 18:43:17 elastiflow sshd[4126]: pam_unix(sshd:auth): authentication failure; logname= uid=0 euid=0 tty=ssh ruser= rhost=61.177.172.19 user=root
jul 20 18:43:19 elastiflow sshd[4126]: Failed password for root from 61.177.172.19 port 45381 ssh2
jul 20 18:43:22 elastiflow sshd[4126]: Failed password for root from 61.177.172.19 port 45381 ssh2
jul 20 18:43:26 elastiflow sshd[4126]: Failed password for root from 61.177.172.19 port 45381 ssh2
jul 20 18:43:26 elastiflow sshd[4126]: Received disconnect from 61.177.172.19 port 45381:11: [preauth]
jul 20 18:43:26 elastiflow sshd[4126]: Disconnected from authenticating user root 61.177.172.19 port 45381 [preauth]
jul 20 18:43:26 elastiflow sshd[4126]: PAM 2 more authentication failures; logname= uid=0 euid=0 tty=ssh ruser= rhost=61.177.172.19 user=root
jul 20 18:43:29 elastiflow sshd[4128]: pam_unix(sshd:auth): authentication failure; logname= uid=0 euid=0 tty=ssh ruser= rhost=61.177.172.19 user=root
jul 20 18:43:31 elastiflow sshd[4128]: Failed password for root from 61.177.172.19 port 26675 ssh2
jul 20 18:43:34 elastiflow sshd[4128]: Failed password for root from 61.177.172.19 port 26675 ssh2
jul 20 18:43:37 elastiflow sshd[4128]: Failed password for root from 61.177.172.19 port 26675 ssh2
jul 20 18:43:38 elastiflow sshd[4128]: Received disconnect from 61.177.172.19 port 26675:11: [preauth]
jul 20 18:43:38 elastiflow sshd[4128]: Disconnected from authenticating user root 61.177.172.19 port 26675 [preauth]
jul 20 18:43:38 elastiflow sshd[4128]: PAM 2 more authentication failures; logname= uid=0 euid=0 tty=ssh ruser= rhost=61.177.172.19 user=root
jul 20 18:47:42 elastiflow sshd[4133]: pam_unix(sshd:auth): authentication failure; logname= uid=0 euid=0 tty=ssh ruser= rhost=61.177.173.49 user=root
jul 20 18:47:44 elastiflow sshd[4133]: Failed password for root from 61.177.173.49 port 25535 ssh2
jul 20 18:47:47 elastiflow sshd[4133]: Failed password for root from 61.177.173.49 port 25535 ssh2
jul 20 18:47:50 elastiflow sshd[4133]: Failed password for root from 61.177.173.49 port 25535 ssh2
jul 20 18:47:51 elastiflow sshd[4133]: Received disconnect from 61.177.173.49 port 25535:11: [preauth]
jul 20 18:47:51 elastiflow sshd[4133]: Disconnected from authenticating user root 61.177.173.49 port 25535 [preauth]
jul 20 18:47:51 elastiflow sshd[4133]: PAM 2 more authentication failures; logname= uid=0 euid=0 tty=ssh ruser= rhost=61.177.173.49 user=root
jul 20 18:48:59 elastiflow sshd[4136]: Unable to negotiate with 61.177.173.61 port 47778: no matching key exchange method found. Their offer: diffie-hellman-group1-sha>
jul 20 18:49:31 elastiflow sshd[4138]: pam_unix(sshd:auth): authentication failure; logname= uid=0 euid=0 tty=ssh ruser= rhost=61.177.172.98 user=root
jul 20 18:49:33 elastiflow sshd[4138]: Failed password for root from 61.177.172.98 port 13179 ssh2
jul 20 18:49:35 elastiflow systemd[1]: Reloading.
jul 20 18:49:35 elastiflow systemd[1]: Reloading.
jul 20 18:49:35 elastiflow systemd[1]: Reloading.
jul 20 18:49:35 elastiflow systemd[1]: Reached target Network is Online.
░░ Subject: Unidade network-online.target concluiu a inicialização
░░ Defined-By: systemd
░░ Support: https://www.debian.org/support
░░
░░ A unidade network-online.target concluiu a inicialização.
░░
░░ The start-up result is done.
jul 20 18:49:35 elastiflow systemd[1]: Starting Elasticsearch…
░░ Subject: Unidade elasticsearch.service sendo iniciado
░░ Defined-By: systemd
░░ Support: https://www.debian.org/support
░░
░░ A unidade elasticsearch.service está sendo iniciada.
jul 20 18:49:36 elastiflow sshd[4138]: Failed password for root from 61.177.172.98 port 13179 ssh2
jul 20 18:49:40 elastiflow sshd[4138]: Failed password for root from 61.177.172.98 port 13179 ssh2
jul 20 18:49:41 elastiflow sshd[4138]: Received disconnect from 61.177.172.98 port 13179:11: [preauth]
jul 20 18:49:41 elastiflow sshd[4138]: Disconnected from authenticating user root 61.177.172.98 port 13179 [preauth]
jul 20 18:49:41 elastiflow sshd[4138]: PAM 2 more authentication failures; logname= uid=0 euid=0 tty=ssh ruser= rhost=61.177.172.98 user=root
jul 20 18:49:44 elastiflow sshd[4391]: pam_unix(sshd:auth): authentication failure; logname= uid=0 euid=0 tty=ssh ruser= rhost=61.177.172.98 user=root
jul 20 18:49:46 elastiflow sshd[4391]: Failed password for root from 61.177.172.98 port 11891 ssh2
jul 20 18:49:49 elastiflow sshd[4391]: Failed password for root from 61.177.172.98 port 11891 ssh2
jul 20 18:49:50 elastiflow systemd-entrypoint[4188]: uncaught exception in thread [main]
jul 20 18:49:50 elastiflow systemd-entrypoint[4188]: BindTransportException[Failed to bind to 187.103.204.1:[9300-9400]]; nested: BindException[Não foi possível acessa>
jul 20 18:49:50 elastiflow systemd-entrypoint[4188]: Likely root cause: java.net.BindException: Não foi possível acessar o endereço requisitado
jul 20 18:49:50 elastiflow systemd-entrypoint[4188]: at java.base/sun.nio.ch.Net.bind0(Native Method)
jul 20 18:49:50 elastiflow systemd-entrypoint[4188]: at java.base/sun.nio.ch.Net.bind(Net.java:555)
jul 20 18:49:50 elastiflow systemd-entrypoint[4188]: at java.base/sun.nio.ch.ServerSocketChannelImpl.netBind(ServerSocketChannelImpl.java:337)
jul 20 18:49:50 elastiflow systemd-entrypoint[4188]: at java.base/sun.nio.ch.ServerSocketChannelImpl.bind(ServerSocketChannelImpl.java:294)
jul 20 18:49:50 elastiflow systemd-entrypoint[4188]: at io.netty.channel.socket.nio.NioServerSocketChannel.doBind(NioServerSocketChannel.java:134)
jul 20 18:49:50 elastiflow systemd-entrypoint[4188]: at io.netty.channel.AbstractChannel$AbstractUnsafe.bind(AbstractChannel.java:562)
jul 20 18:49:50 elastiflow systemd-entrypoint[4188]: at io.netty.channel.DefaultChannelPipeline$HeadContext.bind(DefaultChannelPipeline.java:1334)
jul 20 18:49:50 elastiflow systemd-entrypoint[4188]: at io.netty.channel.AbstractChannelHandlerContext.invokeBind(AbstractChannelHandlerContext.java:506)
jul 20 18:49:50 elastiflow systemd-entrypoint[4188]: at io.netty.channel.AbstractChannelHandlerContext.bind(AbstractChannelHandlerContext.java:491)
jul 20 18:49:50 elastiflow systemd-entrypoint[4188]: at io.netty.channel.DefaultChannelPipeline.bind(DefaultChannelPipeline.java:973)
jul 20 18:49:50 elastiflow systemd-entrypoint[4188]: at io.netty.channel.AbstractChannel.bind(AbstractChannel.java:260)
jul 20 18:49:50 elastiflow systemd-entrypoint[4188]: at io.netty.bootstrap.AbstractBootstrap$2.run(AbstractBootstrap.java:356)
jul 20 18:49:50 elastiflow systemd-entrypoint[4188]: at io.netty.util.concurrent.AbstractEventExecutor.safeExecute(AbstractEventExecutor.java:164)
jul 20 18:49:50 elastiflow systemd-entrypoint[4188]: at io.netty.util.concurrent.SingleThreadEventExecutor.runAllTasks(SingleThreadEventExecutor.java:469)
jul 20 18:49:50 elastiflow systemd-entrypoint[4188]: at io.netty.channel.nio.NioEventLoop.run(NioEventLoop.java:500)
jul 20 18:49:50 elastiflow systemd-entrypoint[4188]: at io.netty.util.concurrent.SingleThreadEventExecutor$4.run(SingleThreadEventExecutor.java:986)
jul 20 18:49:50 elastiflow systemd-entrypoint[4188]: at io.netty.util.internal.ThreadExecutorMap$2.run(ThreadExecutorMap.java:74)
jul 20 18:49:50 elastiflow systemd-entrypoint[4188]: at java.base/java.lang.Thread.run(Thread.java:833)
jul 20 18:49:50 elastiflow systemd-entrypoint[4188]: For complete error details, refer to the log at /var/log/elasticsearch/elasticsearch.log
jul 20 18:49:51 elastiflow systemd[1]: elasticsearch.service: Main process exited, code=exited, status=1/FAILURE
░░ Subject: Unit process exited
░░ Defined-By: systemd
░░ Support: https://www.debian.org/support
░░
░░ An ExecStart= process belonging to unit elasticsearch.service has exited.
░░
░░ The process’ exit code is ‘exited’ and its exit status is 1.
jul 20 18:49:51 elastiflow systemd[1]: elasticsearch.service: Failed with result ‘exit-code’.
░░ Subject: Unit failed
░░ Defined-By: systemd
░░ Support: https://www.debian.org/support
░░
░░ The unit elasticsearch.service has entered the ‘failed’ state with result ‘exit-code’.
jul 20 18:49:51 elastiflow systemd[1]: Failed to start Elasticsearch.
░░ Subject: A unidade elasticsearch.service falhou
░░ Defined-By: systemd
░░ Support: https://www.debian.org/support
░░
░░ A unidade elasticsearch.service falhou.
░░
░░ O resultado é failed.
jul 20 18:49:51 elastiflow systemd[1]: elasticsearch.service: Consumed 46.350s CPU time.
░░ Subject: Resources consumed by unit runtime
░░ Defined-By: systemd
░░ Support: https://www.debian.org/support
░░
░░ The unit elasticsearch.service completed and consumed the indicated resources.
jul 20 18:49:52 elastiflow sshd[4391]: Failed password for root from 61.177.172.98 port 11891 ssh2
jul 20 18:49:53 elastiflow sshd[4391]: Received disconnect from 61.177.172.98 port 11891:11: [preauth]
jul 20 18:49:53 elastiflow sshd[4391]: Disconnected from authenticating user root 61.177.172.98 port 11891 [preauth]
jul 20 18:49:53 elastiflow sshd[4391]: PAM 2 more authentication failures; logname= uid=0 euid=0 tty=ssh ruser= rhost=61.177.172.98 user=root
jul 20 18:49:54 elastiflow sshd[4425]: pam_unix(sshd:auth): authentication failure; logname= uid=0 euid=0 tty=ssh ruser= rhost=61.177.173.36 user=root
jul 20 18:49:56 elastiflow sshd[4425]: Failed password for root from 61.177.173.36 port 34119 ssh2
jul 20 18:49:56 elastiflow sshd[4427]: pam_unix(sshd:auth): authentication failure; logname= uid=0 euid=0 tty=ssh ruser= rhost=61.177.172.98 user=root
jul 20 18:49:58 elastiflow sshd[4427]: Failed password for root from 61.177.172.98 port 58410 ssh2
jul 20 18:49:59 elastiflow sshd[4425]: Failed password for root from 61.177.173.36 port 34119 ssh2
jul 20 18:50:01 elastiflow sshd[4427]: Failed password for root from 61.177.172.98 port 58410 ssh2
jul 20 18:50:02 elastiflow sshd[4425]: Failed password for root from 61.177.173.36 port 34119 ssh2
jul 20 18:50:03 elastiflow sshd[4425]: Received disconnect from 61.177.173.36 port 34119:11: [preauth]
jul 20 18:50:03 elastiflow sshd[4425]: Disconnected from authenticating user root 61.177.173.36 port 34119 [preauth]
jul 20 18:50:03 elastiflow sshd[4425]: PAM 2 more authentication failures; logname= uid=0 euid=0 tty=ssh ruser= rhost=61.177.173.36 user=root
jul 20 18:50:04 elastiflow sshd[4427]: Failed password for root from 61.177.172.98 port 58410 ssh2
jul 20 18:50:05 elastiflow sshd[4427]: Received disconnect from 61.177.172.98 port 58410:11: [preauth]
jul 20 18:50:05 elastiflow sshd[4427]: Disconnected from authenticating user root 61.177.172.98 port 58410 [preauth]
jul 20 18:50:05 elastiflow sshd[4427]: PAM 2 more authentication failures; logname= uid=0 euid=0 tty=ssh ruser= rhost=61.177.172.98 user=root
jul 20 18:50:05 elastiflow sshd[4429]: pam_unix(sshd:auth): authentication failure; logname= uid=0 euid=0 tty=ssh ruser= rhost=61.177.173.36 user=root
root@elastiflow:~# systemctl status elasticsearch
● elasticsearch.service – Elasticsearch
Loaded: loaded (/lib/systemd/system/elasticsearch.service; enabled; vendor preset: enabled)
Active: failed (Result: exit-code) since Wed 2022-07-20 18:49:51 -03; 1min 33s ago
Docs: https://www.elastic.co
Process: 4188 ExecStart=/usr/share/elasticsearch/bin/systemd-entrypoint -p ${PID_DIR}/elasticsearch.pid –quiet (code=exited, status=1/FAILURE)
Main PID: 4188 (code=exited, status=1/FAILURE)
CPU: 46.350s
jul 20 18:49:50 elastiflow systemd-entrypoint[4188]: at io.netty.util.concurrent.SingleThreadEventExecutor.runAllTasks(SingleThreadEventExecutor.java:469)
jul 20 18:49:50 elastiflow systemd-entrypoint[4188]: at io.netty.channel.nio.NioEventLoop.run(NioEventLoop.java:500)
jul 20 18:49:50 elastiflow systemd-entrypoint[4188]: at io.netty.util.concurrent.SingleThreadEventExecutor$4.run(SingleThreadEventExecutor.java:986)
jul 20 18:49:50 elastiflow systemd-entrypoint[4188]: at io.netty.util.internal.ThreadExecutorMap$2.run(ThreadExecutorMap.java:74)
jul 20 18:49:50 elastiflow systemd-entrypoint[4188]: at java.base/java.lang.Thread.run(Thread.java:833)
jul 20 18:49:50 elastiflow systemd-entrypoint[4188]: For complete error details, refer to the log at /var/log/elasticsearch/elasticsearch.log
jul 20 18:49:51 elastiflow systemd[1]: elasticsearch.service: Main process exited, code=exited, status=1/FAILURE
jul 20 18:49:51 elastiflow systemd[1]: elasticsearch.service: Failed with result ‘exit-code’.
jul 20 18:49:51 elastiflow systemd[1]: Failed to start Elasticsearch.
jul 20 18:49:51 elastiflow systemd[1]: elasticsearch.service: Consumed 46.350s CPU time.
root@elastiflow:~# apt install elasticsearch
Lendo listas de pacotes… Pronto
Construindo árvore de dependências… Pronto
Lendo informação de estado… Pronto
elasticsearch is already the newest version (7.17.5).
0 pacotes atualizados, 0 pacotes novos instalados, 0 a serem removidos e 0 não atualizados.
root@elastiflow:~# echo -e “-Xms12g\n-Xmx12g” > /etc/elasticsearch/jvm.options.d/heap.options
root@elastiflow:~# mkdir /etc/systemd/system/elasticsearch.service.d
root@elastiflow:~# cat </etc/systemd/system/elasticsearch.service.d/elasticsearch.conf
> [Service]
> LimitNOFILE=131072
> LimitNPROC=8192
> LimitMEMLOCK=infinity
> LimitFSIZE=infinity
> LimitAS=infinity
> EOF
root@elastiflow:~# sed -i ‘s/#cluster.name: my-application/cluster.name: elastiflow/’ /etc/elasticsearch/elasticsearch.yml
root@elastiflow:~# sed -i ‘s/#network.host: 192.168.0.1/network.host: 127.0.0.1/’ /etc/elasticsearch/elasticsearch.yml
root@elastiflow:~# echo “discovery.type: ‘single-node'” >> /etc/elasticsearch/elasticsearch.yml
root@elastiflow:~# echo “indices.query.bool.max_clause_count: 8192” >> /etc/elasticsearch/elasticsearch.yml
root@elastiflow:~# echo “search.max_buckets: 250000” >> /etc/elasticsearch/elasticsearch.yml
root@elastiflow:~# systemctl daemon-reload
root@elastiflow:~# systemctl enable elasticsearch
Synchronizing state of elasticsearch.service with SysV service script with /lib/systemd/systemd-sysv-install.
Executing: /lib/systemd/systemd-sysv-install enable elasticsearch
root@elastiflow:~# systemctl start elasticsearch
Job for elasticsearch.service failed because the control process exited with error code.
See “systemctl status elasticsearch.service” and “journalctl -xe” for details.
root@elastiflow:~# journalctl -xe
jul 20 18:55:01 elastiflow systemd-entrypoint[4585]: at org.elasticsearch.cli.Command.mainWithoutErrorHandling(Command.java:112)
jul 20 18:55:01 elastiflow systemd-entrypoint[4585]: at org.elasticsearch.cli.MultiCommand.execute(MultiCommand.java:95)
jul 20 18:55:01 elastiflow systemd-entrypoint[4585]: at org.elasticsearch.cli.Command.mainWithoutErrorHandling(Command.java:112)
jul 20 18:55:01 elastiflow systemd-entrypoint[4585]: at org.elasticsearch.cli.Command.main(Command.java:77)
jul 20 18:55:01 elastiflow systemd-entrypoint[4585]: at org.elasticsearch.common.settings.KeyStoreCli.main(KeyStoreCli.java:33)
jul 20 18:55:01 elastiflow systemd-entrypoint[4585]: Caused by: com.fasterxml.jackson.core.JsonParseException: Duplicate field ‘discovery.type’
jul 20 18:55:01 elastiflow systemd-entrypoint[4585]: at [Source: (sun.nio.ch.ChannelInputStream); line: 98, column: 15]
jul 20 18:55:01 elastiflow systemd-entrypoint[4585]: at com.fasterxml.jackson.core.json.JsonReadContext._checkDup(JsonReadContext.java:204)
jul 20 18:55:01 elastiflow systemd-entrypoint[4585]: at com.fasterxml.jackson.core.json.JsonReadContext.setCurrentName(JsonReadContext.java:198)
jul 20 18:55:01 elastiflow systemd-entrypoint[4585]: at com.fasterxml.jackson.dataformat.yaml.YAMLParser.nextToken(YAMLParser.java:399)
jul 20 18:55:01 elastiflow systemd-entrypoint[4585]: at org.elasticsearch.xcontent.json.JsonXContentParser.nextToken(JsonXContentParser.java:73)
jul 20 18:55:01 elastiflow systemd-entrypoint[4585]: at org.elasticsearch.common.settings.Settings.fromXContent(Settings.java:706)
jul 20 18:55:01 elastiflow systemd-entrypoint[4585]: at org.elasticsearch.common.settings.Settings.fromXContent(Settings.java:675)
jul 20 18:55:01 elastiflow systemd-entrypoint[4585]: at org.elasticsearch.common.settings.Settings.access$400(Settings.java:75)
jul 20 18:55:01 elastiflow systemd-entrypoint[4585]: at org.elasticsearch.common.settings.Settings$Builder.loadFromStream(Settings.java:1185)
jul 20 18:55:01 elastiflow systemd-entrypoint[4585]: … 10 more
jul 20 18:55:01 elastiflow systemd-entrypoint[4649]: Exception in thread “main” java.lang.RuntimeException: starting java failed with [1]
jul 20 18:55:01 elastiflow systemd-entrypoint[4649]: output:
jul 20 18:55:01 elastiflow systemd-entrypoint[4649]: #
jul 20 18:55:01 elastiflow systemd-entrypoint[4649]: # There is insufficient memory for the Java Runtime Environment to continue.
jul 20 18:55:01 elastiflow systemd-entrypoint[4649]: # Native memory allocation (mmap) failed to map 12884901888 bytes for committing reserved memory.
jul 20 18:55:01 elastiflow systemd-entrypoint[4649]: # An error report file with more information is saved as:
jul 20 18:55:01 elastiflow systemd-entrypoint[4649]: # /var/log/elasticsearch/hs_err_pid4668.log
jul 20 18:55:01 elastiflow systemd-entrypoint[4649]: error:
jul 20 18:55:01 elastiflow systemd-entrypoint[4649]: OpenJDK 64-Bit Server VM warning: INFO: os::commit_memory(0x00000004c0000000, 12884901888, 0) failed; error=’Not e>
jul 20 18:55:01 elastiflow systemd-entrypoint[4649]: at org.elasticsearch.tools.launchers.JvmOption.flagsFinal(JvmOption.java:119)
jul 20 18:55:01 elastiflow systemd-entrypoint[4649]: at org.elasticsearch.tools.launchers.JvmOption.findFinalOptions(JvmOption.java:81)
jul 20 18:55:01 elastiflow systemd-entrypoint[4649]: at org.elasticsearch.tools.launchers.JvmErgonomics.choose(JvmErgonomics.java:38)
jul 20 18:55:01 elastiflow systemd-entrypoint[4649]: at org.elasticsearch.tools.launchers.JvmOptionsParser.jvmOptions(JvmOptionsParser.java:135)
jul 20 18:55:01 elastiflow systemd-entrypoint[4649]: at org.elasticsearch.tools.launchers.JvmOptionsParser.main(JvmOptionsParser.java:86)
jul 20 18:55:01 elastiflow systemd[1]: elasticsearch.service: Main process exited, code=exited, status=1/FAILURE
░░ Subject: Unit process exited
░░ Defined-By: systemd
░░ Support: https://www.debian.org/support
░░
░░ An ExecStart= process belonging to unit elasticsearch.service has exited.
░░
░░ The process’ exit code is ‘exited’ and its exit status is 1.
jul 20 18:55:01 elastiflow systemd[1]: elasticsearch.service: Failed with result ‘exit-code’.
░░ Subject: Unit failed
░░ Defined-By: systemd
░░ Support: https://www.debian.org/support
░░
░░ The unit elasticsearch.service has entered the ‘failed’ state with result ‘exit-code’.
jul 20 18:55:01 elastiflow systemd[1]: Failed to start Elasticsearch.
░░ Subject: A unidade elasticsearch.service falhou
░░ Defined-By: systemd
░░ Support: https://www.debian.org/support
░░
░░ A unidade elasticsearch.service falhou.
░░
░░ O resultado é failed.
jul 20 18:55:01 elastiflow systemd[1]: elasticsearch.service: Consumed 2.221s CPU time.
░░ Subject: Resources consumed by unit runtime
░░ Defined-By: systemd
░░ Support: https://www.debian.org/support
░░
░░ The unit elasticsearch.service completed and consumed the indicated resources.
root@elastiflow:~# curl -X GET 127.0.0.1:9200
curl: (7) Failed to connect to 127.0.0.1 port 9200: Conexão recusada
root@elastiflow:~# systemctl status elasticsearch
● elasticsearch.service – Elasticsearch
Loaded: loaded (/lib/systemd/system/elasticsearch.service; enabled; vendor preset: enabled)
Drop-In: /etc/systemd/system/elasticsearch.service.d
└─elasticsearch.conf
Active: failed (Result: exit-code) since Wed 2022-07-20 18:55:01 -03; 3min 0s ago
Docs: https://www.elastic.co
Process: 4518 ExecStart=/usr/share/elasticsearch/bin/systemd-entrypoint -p ${PID_DIR}/elasticsearch.pid –quiet (code=exited, status=1/FAILURE)
Main PID: 4518 (code=exited, status=1/FAILURE)
CPU: 2.221s
jul 20 18:55:01 elastiflow systemd-entrypoint[4649]: OpenJDK 64-Bit Server VM warning: INFO: os::commit_memory(0x00000004c0000000, 12884901888, 0) failed; error=’Not e>
jul 20 18:55:01 elastiflow systemd-entrypoint[4649]: at org.elasticsearch.tools.launchers.JvmOption.flagsFinal(JvmOption.java:119)
jul 20 18:55:01 elastiflow systemd-entrypoint[4649]: at org.elasticsearch.tools.launchers.JvmOption.findFinalOptions(JvmOption.java:81)
jul 20 18:55:01 elastiflow systemd-entrypoint[4649]: at org.elasticsearch.tools.launchers.JvmErgonomics.choose(JvmErgonomics.java:38)
jul 20 18:55:01 elastiflow systemd-entrypoint[4649]: at org.elasticsearch.tools.launchers.JvmOptionsParser.jvmOptions(JvmOptionsParser.java:135)
jul 20 18:55:01 elastiflow systemd-entrypoint[4649]: at org.elasticsearch.tools.launchers.JvmOptionsParser.main(JvmOptionsParser.java:86)
jul 20 18:55:01 elastiflow systemd[1]: elasticsearch.service: Main process exited, code=exited, status=1/FAILURE
jul 20 18:55:01 elastiflow systemd[1]: elasticsearch.service: Failed with result ‘exit-code’.
jul 20 18:55:01 elastiflow systemd[1]: Failed to start Elasticsearch.
jul 20 18:55:01 elastiflow systemd[1]: elasticsearch.service: Consumed 2.221s CPU time.
…skipping…
● elasticsearch.service – Elasticsearch
Loaded: loaded (/lib/systemd/system/elasticsearch.service; enabled; vendor preset: enabled)
Drop-In: /etc/systemd/system/elasticsearch.service.d
└─elasticsearch.conf
Active: failed (Result: exit-code) since Wed 2022-07-20 18:55:01 -03; 3min 0s ago
Docs: https://www.elastic.co
Process: 4518 ExecStart=/usr/share/elasticsearch/bin/systemd-entrypoint -p ${PID_DIR}/elasticsearch.pid –quiet (code=exited, status=1/FAILURE)
Main PID: 4518 (code=exited, status=1/FAILURE)
CPU: 2.221s
jul 20 18:55:01 elastiflow systemd-entrypoint[4649]: OpenJDK 64-Bit Server VM warning: INFO: os::commit_memory(0x00000004c0000000, 12884901888, 0) failed; error=’Not e>
jul 20 18:55:01 elastiflow systemd-entrypoint[4649]: at org.elasticsearch.tools.launchers.JvmOption.flagsFinal(JvmOption.java:119)
jul 20 18:55:01 elastiflow systemd-entrypoint[4649]: at org.elasticsearch.tools.launchers.JvmOption.findFinalOptions(JvmOption.java:81)
jul 20 18:55:01 elastiflow systemd-entrypoint[4649]: at org.elasticsearch.tools.launchers.JvmErgonomics.choose(JvmErgonomics.java:38)
jul 20 18:55:01 elastiflow systemd-entrypoint[4649]: at org.elasticsearch.tools.launchers.JvmOptionsParser.jvmOptions(JvmOptionsParser.java:135)
jul 20 18:55:01 elastiflow systemd-entrypoint[4649]: at org.elasticsearch.tools.launchers.JvmOptionsParser.main(JvmOptionsParser.java:86)
jul 20 18:55:01 elastiflow systemd[1]: elasticsearch.service: Main process exited, code=exited, status=1/FAILURE
jul 20 18:55:01 elastiflow systemd[1]: elasticsearch.service: Failed with result ‘exit-code’.
jul 20 18:55:01 elastiflow systemd[1]: Failed to start Elasticsearch.
jul 20 18:55:01 elastiflow systemd[1]: elasticsearch.service: Consumed 2.221s CPU time.
É possível integrar com o grafana? Tem alguma doc ou tutorial??
Hello Expert,
How to Add/Maps Interface for Fortigate in elastiflow with ifName like this
ifName.1″: “dmz”
ifName.2″: “wan1″
ifName.3”: “wan2″
ifName.4”: “modem”
ifName.5″: “ssl.root”
ifName.6″: “internal”
.
.
Thanks
Hello,
you need to set SNMP parameters in your flowcoll.conf.
Environment=”EF_FLOW_DECODER_ENRICH_SNMP_ENABLE=true”
Environment=”EF_FLOW_DECODER_ENRICH_SNMP_COMMUNITY=YOURCOMMUNITY”
Hello
it is still not working, is there any others configuration?
Hello
Please help to fix there is an error with Netflow 9 Cisco ASA 5540
/elastiflow/maxmind# tail -f /var/log/elastiflow/flowcoll/flowcoll.log
2022-07-06T09:11:37.255+0700 warn decode/netflow9.go:413 Netflow v9: template not yet received from xx.xx.xx.xxfor session: 48249, observation domain: 0, template ID 261!
2022-07-06T09:11:37.263+0700 warn decode/netflow9.go:413 Netflow v9: template not yet received from xx.xx.xx.xxfor session: 48249, observation domain: 0, template ID 261!
2022-07-06T09:11:37.263+0700 warn decode/netflow9.go:413 Netflow v9: template not yet received from xx.xx.xx.xxfor session: 48249, observation domain: 0, template ID 265!
2022-07-06T09:11:37.270+0700 warn decode/netflow9.go:413 Netflow v9: template not yet received from xx.xx.xx.xxfor session: 48249, observation domain: 0, template ID 261!
2022-07-06T09:11:37.270+0700 warn decode/netflow9.go:413 Netflow v9: template not yet received from xx.xx.xx.xxfor session: 48249, observation domain: 0, template ID 265!
2022-07-06T09:11:37.270+0700 warn decode/netflow9.go:413 Netflow v9: template not yet received from xx.xx.xx.xxfor session: 48249, observation domain: 0, template ID 261!
2022-07-06T09:11:37.270+0700 warn decode/netflow9.go:413 Netflow v9: template not yet received from xx.xx.xx.xxfor session: 48249, observation domain: 0, template ID 263!
2022-07-06T09:11:37.270+0700 warn decode/netflow9.go:413 Netflow v9: template not yet received from xx.xx.xx.xxfor session: 48249, observation domain: 0, template ID 261!
Thank you
Para Ubiquiti EdgeRouter:
configure
set system flow-accounting interface
set system flow-accounting netflow enable-egress
set system flow-accounting netflow engine-id
set system flow-accounting netflow sampling-rate 250
set system flow-accounting netflow server port 9995
set system flow-accounting netflow timeout expiry-interval 60
set system flow-accounting netflow timeout flow-generic 10
set system flow-accounting netflow timeout icmp 10
set system flow-accounting netflow timeout max-active-life 10
set system flow-accounting netflow timeout tcp-fin 10
set system flow-accounting netflow timeout tcp-generic 10
set system flow-accounting netflow timeout tcp-rst 10
set system flow-accounting netflow timeout udp 10
set system flow-accounting netflow version
set system flow-accounting syslog-facility daemon
commit
save
Valeu!
Podia rolar um tutorial do Logstash + Elasticsearch 🙂
Levantei os serviços exatamente como demonstra o tutorial, no entanto, após 1 minuto coletando, o dashboard zera e fica mostrando zero como se nada mais estivesse sendo coletado. Se reiniciar o servidor ou os serviços, ele volta por 1 minuto e para em seguida. A máquina possui 12 cpus, 1TB de hd e 32GB de RAM. Nenhum registro sobre erro é cospido em qualquer log referente ao Elasticsearch, Elastiflow e nem ao kibana. Será que alguém já passou por isso e tem alguma ideia de como contornar?
Estou com o mesmo problema, você conseguiu a solução ?
Fiz a instalação conforme o tutorial, porém no Kibana quando entro em qualquer Dashboard (Ex: ElastiFlow: AS Traffic (src/dst)) aparece a seguinte mensagem de erro:
No matching indices found: No indices match pattern “elastiflow-flow-codex-*”
Como resolver esse problema?
Também estou com o mesmo problema.
Algum de vocês conseguiu resolver esse problema?
Até hoje não consegui implementar o Elastic na rede.
Peguei o mesmo problema
Vocês já conseguiram resolver?
Verifique se o flowcoll está sendo executado
systemctl status flowcoll.service
Mesmo problema
COnseguiu resolver ?
O meu não esta realizando as coletas atraves do comando tcdump mostra as informações passando mais no elastic nao aparece na dashboard, alguem passou por isso tb?
quando chega nessa parte ( curl -XPOST “http://127.0.0.1:5601/api/saved_objects/_import?overwrite=true”\
-k -H “kbn-xsrf: true” -H “securitytenant: global” –form file=@kibana-7.14.x-codex-dark.ndjson) da erro nao possivel conectar alguem passou por isso?
as duas linhas são um comando só ai nesse caso
Estou com o mesmo problema:
curl: (56) Recv failure: Conexão fechada pela outra ponta
Boa noite a todos.
Excelente tutorial muito bem explicado e objetivo.
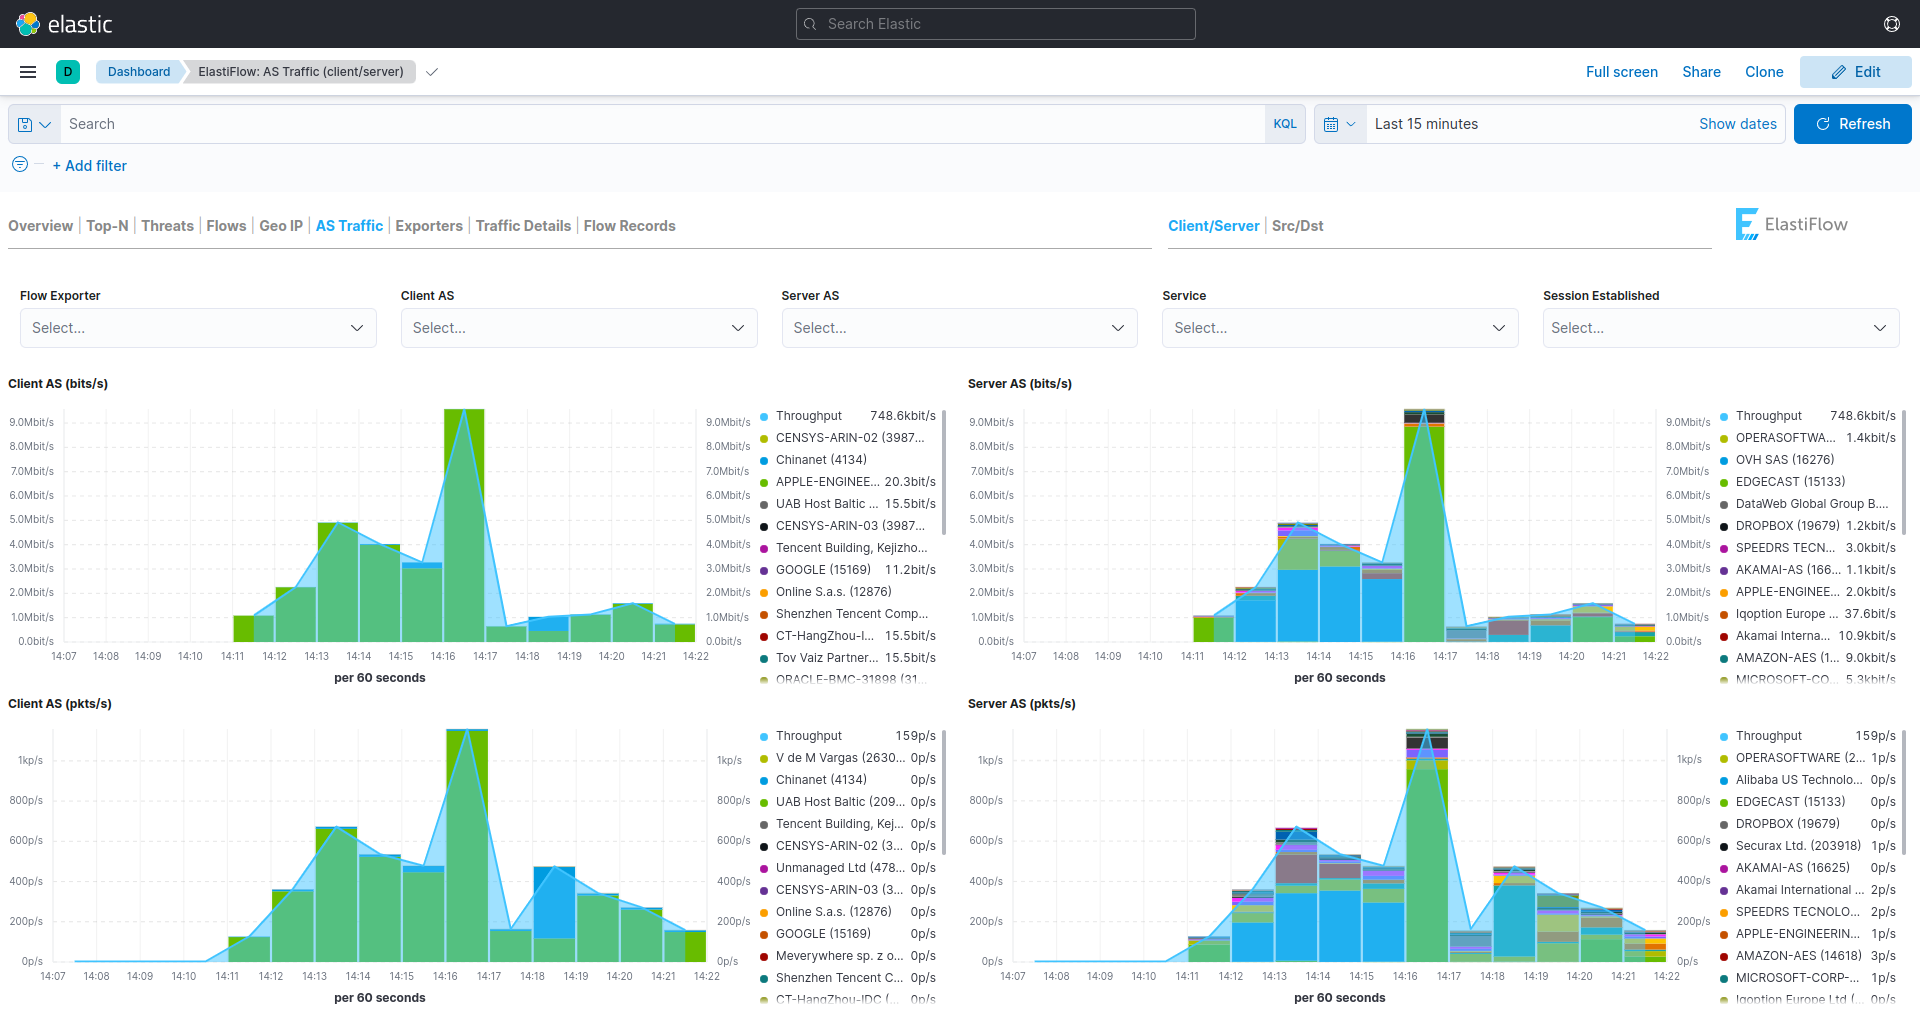
Gostaria de saber o que é o Private dentro do gráfico gerado no “ElastiFlow: Autonomous Systems (bytes)”
Bom dia!
Private = RFC 1918
Perfeito como sempre!
Queria salvar sá as ultmias 48 horas, só pra analize basica da rede, alguém tem um comando onde posso deixar salvo só as ultmias 48h pra não lotar meu hd
Conseguiu ver essa alteração?
Ele consegue separar os fluxos de dados IPv4 e Ipv6, para analisar os dois tráfegos separadamente?
Sim, consegue.
Muito massa.
Fiz aqui e funcionou.
Muito obrigado.
Abs.
P.S: café está pago!
Obrigado! 🤝
Dá para extrair do PFSENSE?
Dá: usa o plugin do NetFlow do PfSense.
No OpnSense está funcionando naturalmente, e ele é um fork do PfSense.